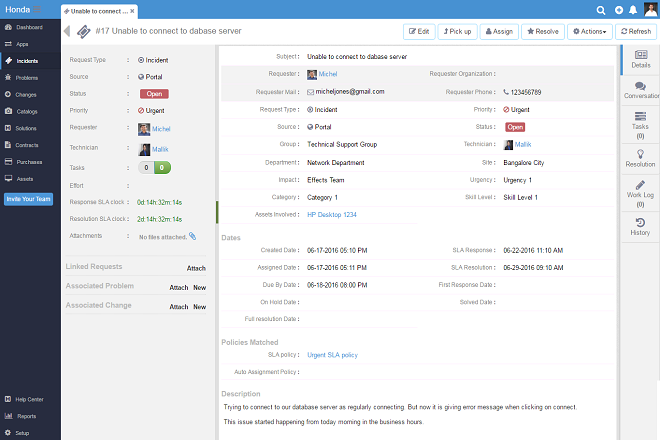
Customizable Dashboards & Widgets

Streamline IT Incident Management with Automation

SERVICEBEE

The Reporting dashboard gives you insight into how your Servicedesk is running. It provides data about your ticket volume and management, forums usage, and agent performance. The data in the reporting dashboard is updated when ever there is change in the performance. The Reporting dashboard includes:
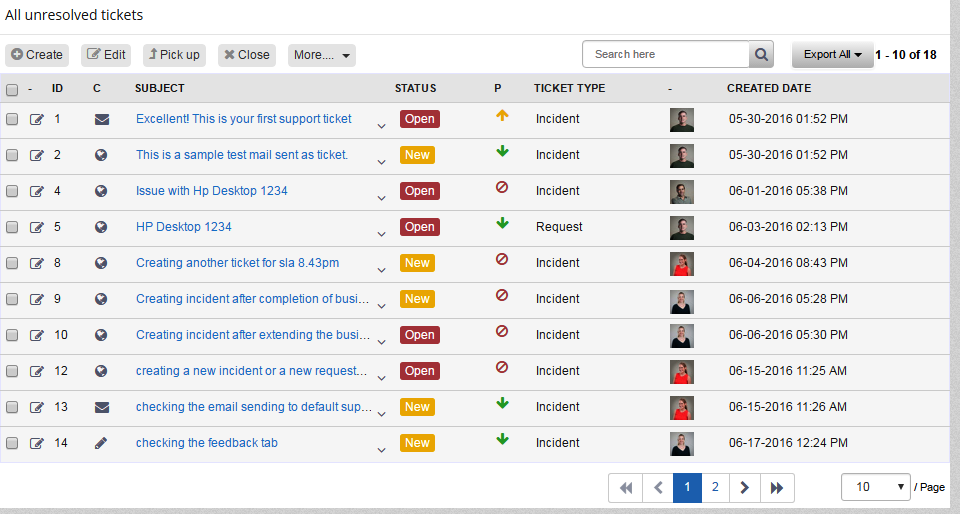
  • Overview shows ticket stats in the top section and enables you to view a ticket statistic or compare two ticket statistics.
  • Leader board provides an agent leaderboard and enables you to gauge agent performance.
  • Hourly Ticket Stream gives you the number of inflow and solved tickets data per hour for 24 hours.
  • First response time widget shows you the count of tickets responded by the agent within one hour after they reached to ITSM Service Desk, responded between 1-4 hrs, 4-10hr and >10hrs ticket count.

-> Customized Widgets

  • Is written in order to make the graphic widget in the GUI look and perform in a specified way, depending on what action the user takes while interfacing with the GUI.
  • The widget is to display text in the right panel of the agent interface.
  • These widgets depend on the login details (admin and agent login). All these widgets are customizable widgets.
  • These widgets can be created for all the KPI's.

-> Customized dashboards

  • Multiple dashboards can be created and can be restricted to whom it should get displayed.
  • We can select the default dashboard to be displayed after logging in to portal.
  • Widgets in the dashboard can be reordered and save the dashboard.
  • You can assign as many as widgets to any dashboard. There is no limit to widgets.
...

Effective incident management do not disrupt business operations

Get started now!

To run your business smoothly

See all our features

Sign up for a free trial today

Get a free 30 day trial with unlimited agents. No credit card required. Get Started Now